
How to Use Posit Cloud: A Beginner's Guide (feat. Barchart)
Post summary
In this post, we will learn how to use Posit Cloud (RStudio Cloud). Use the free cloud service provided by Posit without installing R and RStudio on your local machine.makes it easier to analyze and visualize your data.
How to use Posit Cloud
Access the homepage and sign up
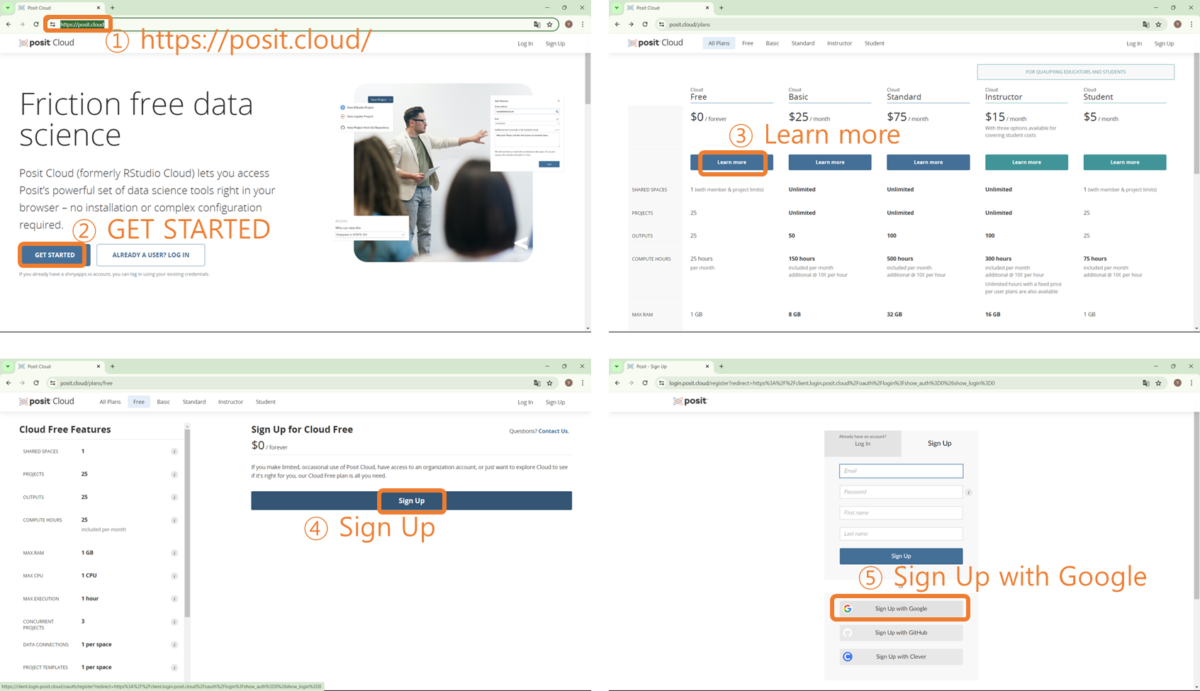
First, use your web browser to open the Access the Posit Cloud homepageClick on 'GET STARTED' and you will be taken to the 'All Plans' screen, select 'Learn more' in the Cloud free column as we will be using it for free. Click on the 'Sign Up' button and proceed with the signup process. If you have a Google ID, you can click the 'Sign Up with Google' button.
Log in to the homepage and create a new project
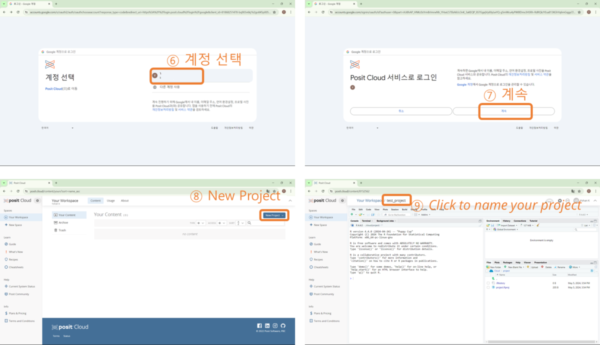
After step ⑤ in the picture above, select account ⑥ as shown below, and the 'Posit Cloud Service Login' screen will appear, and click 'Continue' button. Click 'New Project' on the next screen, and the RStudio screen will appear, and enter a project name ⑨.
Create an R Script and draw a barchart
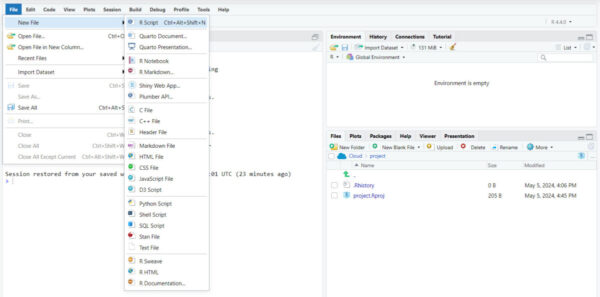
Select File-New File - R Script and the R Script window will appear, or you can press the keyboard shortcut (Ctrl + Alt + Shift + N).
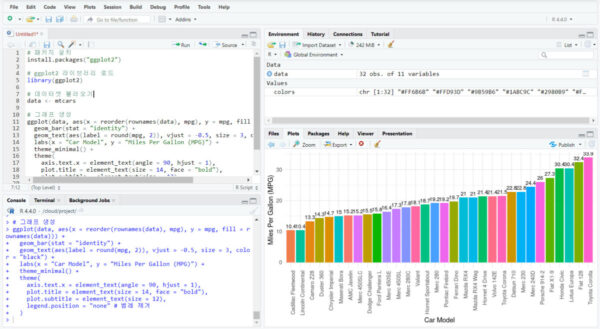
Copy & Paste the below source code into the R Script window. Select the entire source code (keyboard shortcut: Ctrl + A) and press the 'Run' button (or keyboard shortcut Ctrl + Enter).
Install the # package
install.packages("ggplot2")

Load the # ggplot2 library
library(ggplot2)

Load the # dataset
data <- mtcars

Generate a # graph
ggplot(data, aes(x = reorder(rownames(data), mpg), y = mpg, fill = rownames(data))) +
  geom_bar(stat = "identity") +
  geom_text(aes(label = round(mpg, 2)), vjust = -0.5, size = 3, color = "black") +
  labs(x = "Car Model", y = "Miles Per Gallon (MPG)") +
  theme_minimal() +
  theme(
    axis.text.x = element_text(angle = 90, hjust = 1),
    plot.title = element_text(size = 14, face = "bold"),
    plot.subtitle = element_text(size = 12),
    legend.position = "none" # Remove legend
  )
When you run the above source code, you'll see a colorful and trendy barchart like the one below. Now all you need is some data and a computer with internet access, and you're free to play around with the information you want to analyze and visualize.
Organize
In this post, we signed up for the Posit Cloud (RStuido Cloud) service and plotted a barchart using R's built-in data. Looking at the source code makes my head hurt, but now you can use AI services to do this, right? If you don't know what I mean, I recommend the post below.
All content on 'secondlife.lol' is protected by copyright law. Unauthorized reprinting, copying, distribution, etc. is prohibited.


